Quick Answer: LiFePO4 cycle life measures the total equivalent charge-discharge cycles a battery pack delivers before reaching End of Life (EOL)—typically 80% retained capacity. Under standard test conditions, Grade A LiFePO4 modules yield ≥6,000 cycles at 90% Depth of Discharge (DoD). Capping daily DoD at 80% extends cycle life to ≥10,000 cycles.
1. Defining Core Metrics: Cycle Count, Depth of Discharge (DoD), and End of Life (EOL)
Evaluating storage hardware within an off-grid solar power system architecture requires precise degradation baselines. Comparing energy storage system (ESS) options without standardized parameters skews Levelized Cost of Storage (LCOS) calculations and leads to misconfigured hardware.
1.1 What Constitutes One Full Charge-Discharge Cycle?
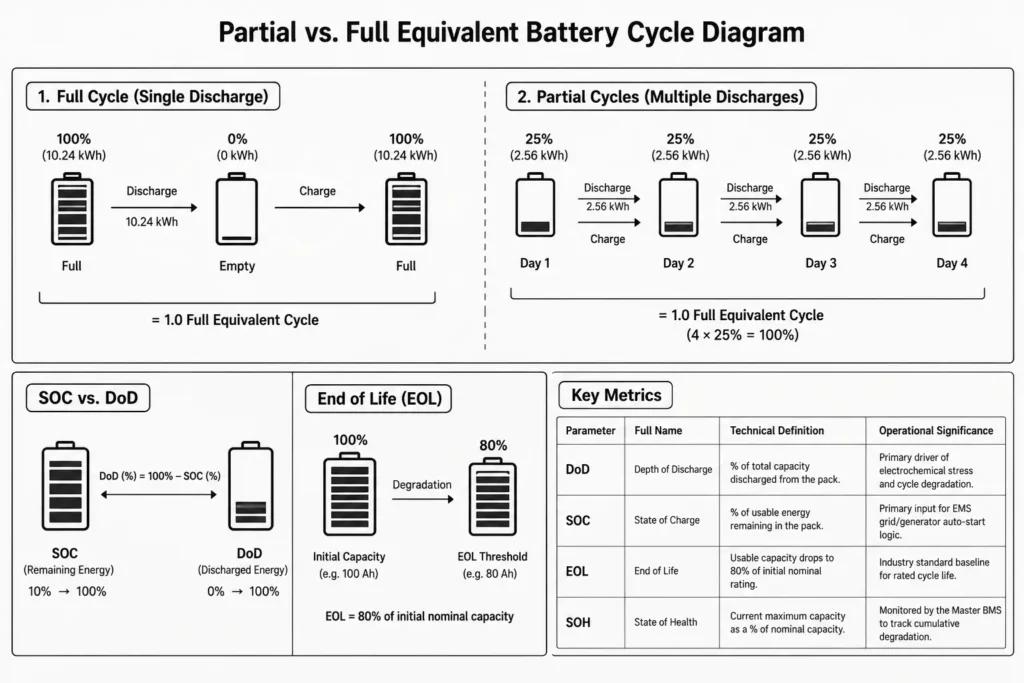
A cycle is not just a single charge or discharge event. One equivalent full cycle (EFC) equals cumulative throughput matching 100% of rated nameplate capacity, whether delivered in one continuous run or across multiple partial discharges.
For example, on a 10.24 kWh Lithium Iron Phosphate (LiFePO4) pack:
- Discharging 10.24 kWh in a single run and recharging back to 100% equals 1.0 Full Equivalent Cycle.
- Discharging 2.56 kWh (25% DoD) daily across 4 consecutive days equals 1.0 Full Equivalent Cycle (4 × 25% = 100%).
Grade A LiFePO4 cells have zero memory effect. Shallow cycling mitigates mechanical stress on the cathode, while system controllers log cumulative energy throughput to quantify true cell wear.
1.2 Depth of Discharge (DoD) vs. State of Charge (SOC) Explained
State of Charge (SOC) and Depth of Discharge (DoD) represent complementary metrics for remaining and consumed capacity:
- State of Charge (SOC): Usable electrical energy remaining relative to maximum capacity (0% = Empty, 100% = Full).
- Depth of Discharge (DoD): Total energy discharged relative to maximum capacity (0% = Full, 100% = Empty).
The operational relationship is inverse:
DoD (%) = 100% – SOC (%)
If an Energy Management System (EMS) halts discharge at 10% SOC, the pack operates at 90% DoD. If the EMS cuts off at 20% SOC, the pack runs at 80% DoD. DoD limits directly dictate cell degradation rates.
1.3 End of Life (EOL) Thresholds: Why 80% Capacity Retention Is Industry Standard
In stationary BESS, End of Life (EOL) does not mean catastrophic failure or an offline pack. It marks the point where usable capacity drops to 80% of rated nameplate capacity under standard test conditions.
A 100 Ah cell at EOL still delivers 80 Ah. However, escalating internal resistance (Ri) accelerates voltage sag under load, compromising system runtime during high-demand intervals.
| Parameter | Full Name | Technical Definition | Operational Significance |
| DoD | Depth of Discharge | Percentage of total capacity discharged from the pack. | Primary driver of electrochemical stress and cycle degradation. |
| SOC | State of Charge | Percentage of usable energy remaining in the pack. | Primary input for EMS grid/generator auto-start logic. |
| EOL | End of Life | Point where usable capacity drops to 80% of initial nominal rating. | Industry standard baseline for defining rated cycle life. |
| SOH | State of Health | Current maximum capacity expressed as a percentage of nominal capacity. | Monitored by the Master BMS to track cumulative degradation. |
2. The Physics of LiFePO4 Cell Degradation: Why DoD Drives Lifespan
Stationary BESS relies on LiFePO4 chemistry for intrinsic thermal runaway resistance and long cycle life. Even so, daily lithium-ion intercalation and de-intercalation gradually degrade the prismatic cell structure.
2.1 Mechanical Stress and Lattice Strain in Prismatic LFP Cathodes
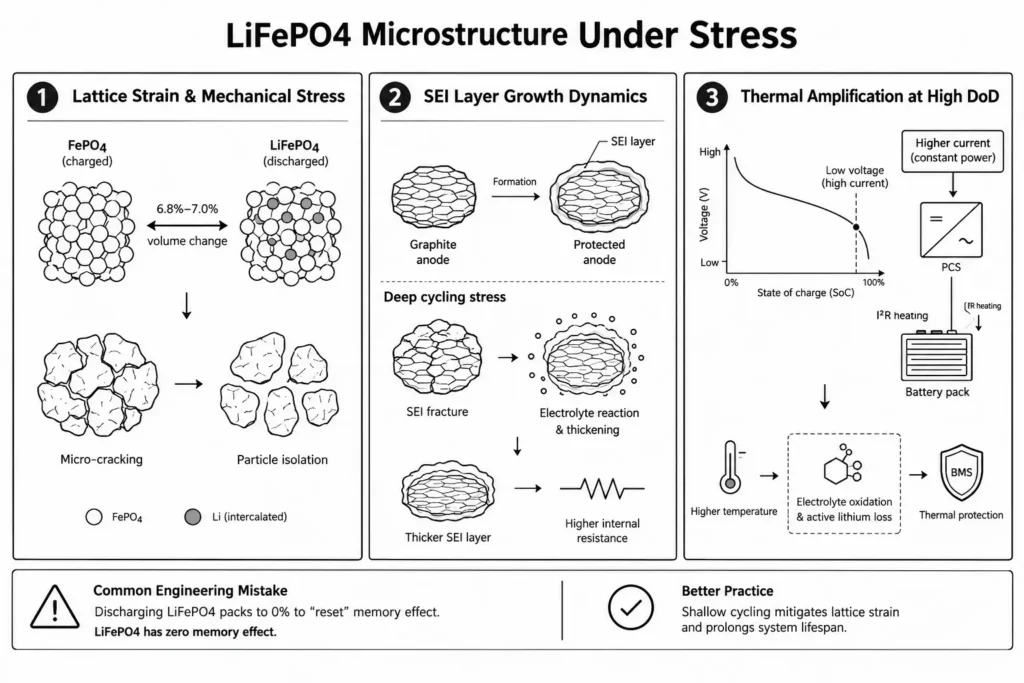
The LFP cathode utilizes an olivine crystal matrix (LiFePO4). During discharge, lithium ions de-intercalate from the graphite anode, migrate across the separator via the organic electrolyte, and intercalate into the iron phosphate (FePO4) host lattice.
This migration drives continuous phase transitions:
- Fully charged state: Lithium-depleted iron phosphate phase (FePO4).
- Fully discharged state: Fully lithiated iron phosphate phase (LiFePO4).
Lithium transport forces an isotropic lattice volume change of 6.8% to 7.0%. Operating at high DoD levels subjects the crystal structure to extreme mechanical swings. Repeated lattice strain causes micro-cracking and particle isolation. Over thousands of cycles, this mechanical fatigue disconnects active material and spikes internal cell resistance.
2.2 Solid Electrolyte Interphase (SEI) Layer Growth Dynamics
Grade A prismatic LFP cells utilize synthetic graphite anodes. During factory formation, initial electrolyte decomposition generates a protective Solid Electrolyte Interphase (SEI) layer on the graphite surface. A passivating SEI film permits lithium-ion transport while blocking parasitic electrolyte breakdown.
Aggressive deep cycling stresses this interface through two destructive mechanisms:
- SEI Layer Fracture & Regeneration: Anode volume expansion fractures the brittle SEI film during deep cycling. Exposed graphite directly reacts with bulk electrolyte, irreversibly consuming active lithium inventory and thickening the passivation layer.
- Impedance Rise: A thicker SEI layer chokes ionic diffusion and elevates internal resistance. This generates higher I²R resistive losses during high C-rate cycling.
2.3 Thermal Amplification of Degradation at High DoD Levels
Operating near the lower end of the discharge curve compounds cell degradation. As pack voltage drops down the discharge curve, the PCS draws higher amperage to sustain constant power output. This elevated current amplifies internal heating via I²R resistive losses.
Elevated cell temperatures accelerate electrolyte oxidation and irreversibly consume active lithium inventory under Arrhenius kinetics. Multi-tier BMS protection must clamp these thermal thresholds to prevent localized cell heating and premature end of life.
Common Engineering Mistake: Discharging LiFePO4 packs to 0% to “reset” non-existent memory effect. LiFePO4 has zero memory effect. Shallow cycling mitigates lattice strain and prolongs system lifespan.
3. Benchmark Analysis: 6,000 Cycles @ 90% DoD vs. 10,000 Cycles @ 80% DoD
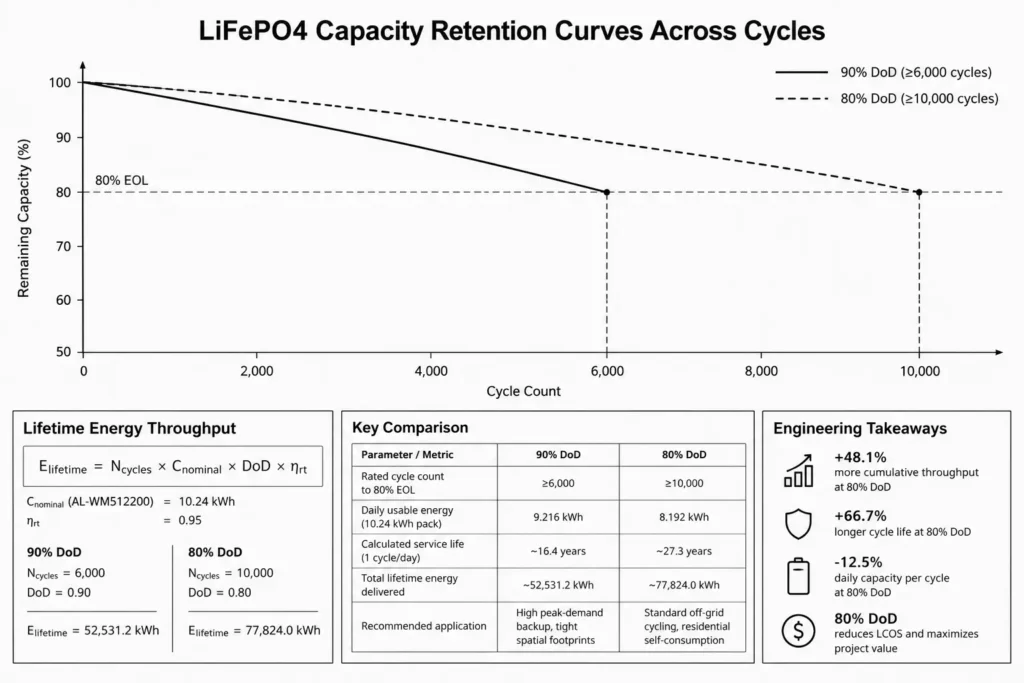
BESS datasheets typically present dual cycle-life benchmarks: ≥6,000 cycles at 90% DoD versus ≥10,000 cycles at 80% DoD. Converting these ratings into cumulative lifetime throughput governs bank sizing and project ROI modeling.
3.1 Comparative Lifetime Energy Throughput Calculations
System designers evaluate Total Lifetime Energy Throughput (E_lifetime) to benchmark real asset value. This metric quantifies cumulative delivered energy before reaching the 80% EOL threshold.
Baseline formula for Lifetime Energy Throughput:
E_lifetime = N_cycles × C_nominal × DoD × η_rt
Where:
- N_cycles: Total rated cycle count at the target DoD.
- C_nominal: Nominal pack capacity (kWh).
- DoD: Operating Depth of Discharge (decimal).
- η_rt: AC-to-AC round-trip efficiency factor (assumed at 0.95).
Case study: A Haven Deer AL-WM512200 wall-mounted module (51.2V, 200Ah / 10.24 kWh):
Scenario A: Daily Operation at 90% DoD
- Nominal Capacity (C_nominal): 10.24 kWh
- Rated Cycles (N_cycles): 6,000 Cycles
- Depth of Discharge (DoD): 0.90 (9.216 kWh delivered per full cycle)
- Round-Trip Efficiency (η_rt): 0.95E_lifetime (90% DoD) = 6,000 × 10.24 kWh × 0.90 × 0.95 = 52,531.2 kWh
Scenario B: Daily Operation at 80% DoD
- Nominal Capacity (C_nominal): 10.24 kWh
- Rated Cycles (N_cycles): 10,000 Cycles
- Depth of Discharge (DoD): 0.80 (8.192 kWh delivered per full cycle)
- Round-Trip Efficiency (η_rt): 0.95E_lifetime (80% DoD) = 10,000 × 10.24 kWh × 0.80 × 0.95 = 77,824.0 kWh
3.2 Why 80% Daily DoD Is the Recommended Engineering Standard
Comparing both operating strategies:
E_lifetime Gain = (77,824.0 kWh – 52,531.2 kWh) / 52,531.2 kWh = +48.1%
Capping daily discharge at 80% yields +48.1% more cumulative throughput over the asset lifecycle.
While 90% DoD yields more daily capacity (9.216 kWh vs. 8.192 kWh), an 80% limit cuts lattice fatigue and extends cycle life by 66.7%. For daily cycling, cap discharge at 80% DoD. 80% DoD maximizes project LCOS.
| Parameter / Metric | 90% DoD Operating Strategy | 80% DoD Operating Strategy | Engineering Performance Variance |
| Rated Cycle Count to 80% EOL | ≥6,000 Cycles | ≥10,000 Cycles | +66.7% rated cycle count increase |
| Daily Usable Energy (10.24 kWh Pack) | 9.216 kWh | 8.192 kWh | -12.5% daily capacity per cycle |
| Calculated Service Life (1 Cycle/Day) | ~16.4 Years | ~27.3 Years | +10.9 Years of operational service |
| Total Lifetime Energy Delivered | ~52,531.2 kWh | ~77,824.0 kWh | +48.1% total lifetime energy throughput |
| Recommended Application | High peak-demand backup, tight spatial footprints | Standard off-grid cycling, residential self-consumption | 80% DoD reduces Levelized Cost of Storage (LCOS) |
4. Standardized Testing Protocols (IEC 62619) vs. Real-World Solar Operation
Datasheet cycle ratings reflect benign bench conditions, not harsh field environments. Sizing reliable systems requires derating laboratory figures against real-world operating stressors.
4.1 Standard Test Conditions (STC) in Laboratory Life Testing
Standards like IEC 62619 and IEC 62620 benchmark industrial lithium cells under tightly controlled baselines:
- Ambient Temperature: Maintained precisely at 25°C ± 2°C throughout the test cycle.
- Charge Rate: Constant Current / Constant Voltage (CC/CV) at 0.5C (0.5 × Nominal Capacity) to upper cutoff voltage.
- Discharge Rate: Constant Current at 0.5C down to the manufacturer’s lower cutoff limit.
- Rest Period: 30 to 60 minutes between charge and discharge steps for thermal relaxation.
Under these ideal bench conditions, Grade A prismatic cells easily reach 6,000 to 10,000 cycles. Field installations rarely mirror these parameters.
4.2 Real-World Stress Factors: Variable C-Rates, Ambient Temperatures, and Partial Cycles
Field installations subject battery packs to three primary stress vectors:
- Thermal Volatility: Equipment rooms without climate control swing through extreme diurnal temperatures. High ambient heat accelerates capacity fade and SEI layer growth. Conversely, sub-freezing temperatures freeze ionic conductivity and spike internal resistance. Never attempt LiFePO4 low temperature charging below 0°C. Sub-zero charging causes irreversible lithium plating and internal short-circuits.
- Variable C-Rates: Inductive loads like pumps, compressors, and HVAC units pull high inrush currents. These micro-surges spike cell core temperatures via localized I²R heating.
- Partial State of Charge (PSOC) Cycling: Off-grid systems rarely complete clean CC/CV curves. Intermittent solar irradiance and variable consumption trap cells in continuous dynamic micro-cycles.
Engineering Tip: Derate cycle-life expectations by 20–30% if ambient equipment room temperatures consistently exceed 35°C. Heat accelerates electrolyte dry-out.
| Parameter | IEC 62619 / 62620 Lab Testing Baseline | Real-World Off-Grid Solar Field Conditions |
| Ambient Temperature | Fixed at 25°C ± 2°C | Unconditioned outbuildings (-10°C to 45°C seasonal swings) |
| Charge / Discharge Current | Continuous 0.5C constant current | Intermittent solar input and severe inrush load spikes |
| State of Charge Range | Full 0% to 100% continuous sweeps | Irregular Partial State of Charge (PSOC) micro-cycling |
| Thermal Dissipation | Open-rack, ambient bench circulation | Enclosed IP21/IP65 cabinets with localized thermal trapping |
5. Calculating Lifetime Energy Throughput and Levelized Cost of Storage (LCOS)
Evaluating BESS solely on upfront CAPEX ($/kWh) is an engineering trap. Lower initial hardware costs frequently mask punishing replacement cycles and labor overhead. Standardized Levelized Cost of Storage (LCOS) models provide the only accurate framework for evaluating LiFePO4 vs lead acid cost.
5.1 Mathematical Formula for Lifetime Delivered Energy
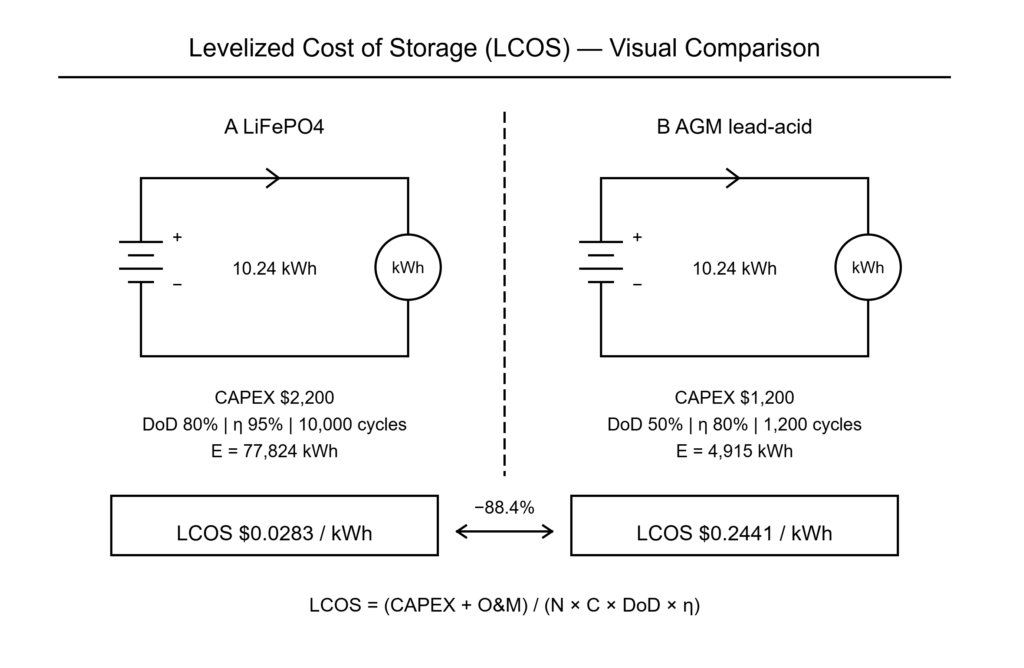
LCOS quantifies the net cost per delivered kilowatt-hour over full asset life, factoring initial CAPEX against cumulative energy throughput.
Baseline formula for LCOS:
LCOS ($/kWh) = (Initial Battery CAPEX + Lifetime Maintenance Costs) / Total Lifetime Energy Throughput (kWh)
Where Total Lifetime Energy Throughput is defined by:
E_lifetime = N_cycles × C_nominal × DoD × η_rt
5.2 Cost Per kWh Delivered: Grade A LiFePO4 vs. Lead-Acid (AGM/Gel)
To benchmark lifecycle economics, consider a 10.24 kWh nominal residential storage requirement comparing Grade A LiFePO4 against traditional industrial deep-cycle AGM:
Hardware Assumptions:
- System Storage Requirement: 10.24 kWh Nominal Capacity
- Option A: Haven Deer AL-WM512200 LiFePO4 home solar battery
- Initial Cost (CAPEX): $2,200
- Operating DoD: 80% (rated cycle life ≥10,000 cycles)
- Round-Trip Efficiency: 95% (0.95)
- Maintenance Cost: $0 (Maintenance-Free)
- Option B: Industrial Deep-Cycle AGM Lead-Acid Bank
- Initial Cost (CAPEX): $1,200
- Operating DoD: 50% (maximum 1,200 cycles recommended)
- Round-Trip Efficiency: 80% (0.80)
- Maintenance Cost: Minimal over life
Step 1: Calculate Lifetime Energy Throughput
- Option A (LiFePO4 @ 80% DoD):E_lifetime = 10,000 × 10.24 kWh × 0.80 × 0.95 = 77,824.0 kWh
- Option B (Lead-Acid @ 50% DoD):E_lifetime = 1,200 × 10.24 kWh × 0.50 × 0.80 = 4,915.2 kWh
Step 2: Calculate Levelized Cost of Storage (LCOS)
- Option A (LiFePO4):LCOS = $2,200 / 77,824.0 kWh = $0.0283 per kWh delivered
- Option B (Lead-Acid):LCOS = $1,200 / 4,915.2 kWh = $0.2441 per kWh delivered
Grade A LiFePO4 slashes LCOS by 88.4% ($0.0283/kWh vs. $0.2441/kWh). Lead-acid requires at least 8 repowering cycles to match one LiFePO4 pack. Factoring replacement freight and site labor renders lead-acid financially unviable for daily cycling.
| Technical / Financial Metric | Haven Deer Grade A LiFePO4 (AL-WM512200) | Traditional Deep-Cycle AGM Lead-Acid Bank |
| Nominal System Capacity | 10.24 kWh | 10.24 kWh |
| Recommended Daily DoD | 80% DoD | 50% Maximum DoD |
| Rated Cycle Life | ≥10,000 Cycles | 500 to 1,200 Cycles |
| Round-Trip Energy Efficiency | >95% | 75% to 80% |
| Total Lifetime Delivered Energy | ~77,824.0 kWh | ~4,915.2 kWh |
| Levelized Cost of Storage (LCOS) | ~$0.0283 / kWh | ~$0.2441 / kWh |
| Expected System Lifespan | 15 to 20+ Years (design rating) | 3 to 5 Years (Requires Replacements) |
6. Engineering Recommendations to Maximize Off-Grid Battery System Lifespan
Maximizing BESS asset life hinges on three commissioning variables: active closed-loop communication, tight voltage window clamping, and environmental control. Field engineers must program these thresholds directly into the inverter EMS.
6.1 BMS Inverter Configuration: Setting Cutoff Voltages and SOC Limits
For 16S (51.2V nominal) prismatic banks, pair hybrid solar inverters (such as the Haven Deer ALL 4812000 Pro or ALL 486000 Pro) using closed-loop CAN or RS485 protocols. In an open loop vs closed loop BMS comparison, closed-loop communication wins because it prevents rogue charging states.
If commissioning in open-loop lead-acid emulation mode, manually program the following protective setpoints:
| Parameter | Recommended Value (16S 51.2V System) | Cell-Level Equivalent | Operational Purpose |
| Max Charge Voltage (Bulk/Absorption) | 56.0V to 56.8V | 3.50V to 3.55V per cell | Caps top-end charge while granting the BMS sufficient dwell time for passive cell balancing. |
| Float Charge Voltage | 53.6V to 54.0V | 3.35V to 3.37V per cell | Sustains standby charge while suppressing continuous lattice strain from high resting voltages. |
| Low DC Cut-off Voltage (90% DoD) | 44.8V | 2.80V per cell | Hard cutoff threshold to prevent cell inversion under severe transient loads. |
| Low DC Cut-off Voltage (80% DoD) | 48.0V | 3.00V per cell | Recommended baseline for daily cycling to hit the ≥10,000 cycle milestone. |
| Inverter Generator Auto-Start Threshold | 15% to 20% SOC (or 48.4V) | 3.025V per cell | Triggers the inverter dry-contact relay to start backup power before hitting low-voltage disconnect. |
6.2 Thermal Management and Equipment Room Environmental Control
- Maintain Ambient Range: Maintain ambient room temperature between 15°C and 25°C. Sustained operation above 35°C accelerates calendar aging and doubles capacity fade.
- Prevent Sub-Zero Charging: Never charge LiFePO4 below 0°C. Sub-zero charging plates metallic lithium onto the anode, causing permanent capacity loss and internal short-circuits. Confirm that the Master BMS low-temperature charge cutoff is active.
- Ensure Structural Clearance: Maintain a minimum 150 mm (6-inch) clearance around wall-mount units (AL-WM512100 / AL-WM512200) and floor cabinets off-grid solar battery (MB512300 / MB512346) to sustain convective cooling.
Commissioning Checklist for Max Battery Lifespan:
- Establish Closed-Loop Comms: Verify active CAN/RS485 communication between the hybrid inverter and Master BMS.
- Set Unique Addressing: Confirm DIP switches on parallel battery modules follow a non-conflicting addressing sequence.
- Lock Current Limits: Program continuous charge and discharge current limits to match cell C-rate ratings.
- Clamp Discharge Depth: Configure inverter low-voltage or SOC cutoff limits to 80% DoD for long-term cycling assets.
- Torque Busbars to Spec: Torque all DC busbars and battery terminals to manufacturer specifications using a calibrated torque wrench. Loose lugs cause localized thermal hotspots and nuisance BMS trips.
7. Technical FAQ: Battery Cycle Life & DoD Optimization
Q1: What does “6000 cycles at 90% DoD” actually mean?
It benchmarks 6,000 equivalent full cycles (EFC) at 90% DoD before usable capacity drops to 80% nameplate rating under standard test conditions. The pack is not dead at EOL; it simply holds 80% capacity.
Q2: Does discharging my LiFePO4 battery to 100% DoD ruin it?
An occasional 100% discharge will not brick the pack. However, continuous 100% cycling accelerates lattice micro-cracking and SEI breakdown. Set low-voltage cutoffs to avoid resting at zero charge.
Q3: Why does reducing DoD from 90% to 80% increase cycle life from 6,000 to 10,000 cycles?
Truncating discharge to 80% DoD cuts mechanical lattice strain and suppresses SEI micro-fracturing. Shallower cycling extends operational throughput by 48.1%.
Q4: What happens when a battery reaches its 80% EOL (End of Life)?
The battery remains fully operational. EOL simply marks where capacity drops to 80% (8.19 kWh on a 10.24 kWh pack) and internal resistance (Ri) rises. Run the pack until load-induced voltage sag violates inverter minimums.
Q5: How many years will a 6000-cycle LiFePO4 battery last in daily off-grid solar operation?
At 1 EFC daily, 6,000 cycles (90% DoD) yields ~16.4 years of service. Running at 80% DoD (10,000 cycles) delivers ~27.3 years. Calendar aging and ambient heat will typically cap real-world asset life around 20 years.
Q6: Does temperature affect the cycle life of solar ESS batteries?
Temperature dictates degradation speed. Operating above 35°C doubles calendar fade via Arrhenius kinetics. Charging below 0°C plates metallic lithium, permanently shorting cells.
Q7: What inverter cut-off settings should I use for a 51.2V Haven Deer LiFePO4 battery?
For 16S (51.2V), program absorption at 56.0V–56.8V (3.50V–3.55V/cell) and float at 53.6V (3.35V/cell). Set the low DC cutoff to 48.0V (3.00V/cell) for 80% DoD cycling, or 44.8V (2.80V/cell) for 90% backup reserve.
Q8: How do partial cycles affect battery degradation?
Two 40% discharge runs equal 0.8 EFC. LiFePO4 experiences far less lattice strain under partial cycling than under continuous deep draws. Shallow cycling always extends throughput.
Q9: What is the difference between calendar life and cycle life?
Cycle life measures throughput-driven wear from active ionic shuttling. Calendar life measures passive chemical decomposition while sitting idle. Storing cells at 100% SOC in high ambient heat rapidly accelerates calendar fade without logging a single cycle.
Q10: Are low-grade or repurposed EV battery cells capable of reaching 6000 cycles at 90% DoD?
No. Decommissioned EV and Grade B cells suffer from divergent internal resistance (Ri) and severe capacity mismatch. Passive BMS balancers cannot correct this delta, triggering premature low-voltage cutoffs. Grade A cells are mandatory for 6,000+ cycle lifespans.
8. Request a Custom ESS Battery Sizing & LCOS Analysis
Sizing a residential, agricultural, or commercial off-grid solar power system requires precise load profiling and thermal derating. Hardware misconfiguration destroys project economics.
Submit your site load data and irradiance profile to Haven Deer’s application engineering team for project-specific LCOS modeling, DoD optimization, and thermal clearance analysis.